What is rrricanes
Why Write rrricanes?
There is a tremendous amount of weather data available on the internet. Much of it is in raw format and not very easy to obtain. Hurricane data is no different. When one thinks of this data they may be inclined to think it is a bunch of map coordinates with some wind values and not much else. A deeper look will reveal structural and forecast data. An even deeper look will find millions of data points from hurricane reconnaissance, computer forecast models, ship and buoy observations, satellite and radar imagery, …
rrricanes is an attempt to bring this data together in a way that doesn’t just benefit R users, but other languages as well.
I began learning R in 2015 and immediately had wished I had a hurricane-specific dataset when Hurricane Patricia became a harmless, but historic hurricane roaming the Pacific waters. I found this idea revisited again as Hurricane Matthew took aim at Florida and the southeast in 2016. Unable to use R to study and consolidate Matthew’s data in R led me to begin learning package development. Thus, the birth of rrricanes.
In this article, I will take you on a lengthy tour of the most important features of rrricanes and what the data means. If you have a background working with hurricane data, most of this will be redundant. My aim here is to cover the big ideas behind the package and explain them under the assumption you, the reader, are unfamiliar with the data offered.
rrricanesis not intended to be used in emergency situations. I write this article as areas I have lived or currently live are under the gun from Hurricane Harvey and rrricanes is unable to obtain data due to external issues (I will describe these later). It is designed with the intent of answering questions and exploring ideas outside of a time-sensitive environment.
rrricanes will not be available in CRAN for quite some time. The current schedule is May 15, 2018 (the “start” of the East Pacific hurricane season). This year is soley for testing under real-time conditions.
And rrricanesdata
The NHC archives text products dating back to at least 1998 (some earlier years exist but yet to be implemented in this package). Accessing this data is a time-consuming process on any computer. A limit of 4 requests per second is put in place to avoid being banned (or restricted) from the archives. So, if a hurricane has 20 text products you wish to pull and parse, this will take 5 seconds. Most cyclones have more and some, far more.
rrricanesdata is a compliment package to rrricanes. rrricanesdata contains post-scraped datasets of the archives for all available storms with the exception of advisories issued in the current month.This means you can explore the various datasets without the wait.
rrricanesdata will be updated monthly if an advisory has been issued the previous month. There will be regular monthly updates approximately from May through November - the typical hurricane season. In some cases, a cyclone may develop in the off-season. rrricanesdata will be updated on the same schedule.
ELI5 the Data
This package covers tropical cyclones that have developed in the Atlantic basin (north Atlantic ocean) or East Pacific basin (northeast Pacific east of 140#°W). Central Pacific (140#°W - 180#°W) may be mixed in if listed in the NHC archives.
While traditionally the hurricane season for each basin runs from mid-May or June through November, some cyclones have developed outside of this time frame.
Every tropical cylone (any tropical low whether classified as a tropical depression, tropical storm or hurricane) contains a core set of text products officially issued from the National Hurricane Center. These products are issued every six hours.
Much of this data has changed in format over the years. Some products have been discontinued and replaced by new products or wrapped into existing products. Some of these products are returned in raw text format; it is not cleaned and may contain HTML characters. Other products are parsed with every piece of data extracted and cleaned.
I have done my best to ensure data is high quality. But, I cannot guarantee it is perfect. If you do believe you have found an error, please let me know; even if it seems small. I would rather be notified of a false error than ignore a true one.
The Products
Each advisory product is listed below with an abbreviation in parentheses. Unless otherwise noted, these products are issued every six hours. Generally, the times issued are 03:00, 09:00, 15:00 and 21:00 UTC. Some products may be issued in three-hour increments and, sometimes, two-hour increments. update can be issued at any time.
Storm Discussion (discus) - These are technical discussions centered on the current structure of the cyclone, satellite presentation, computer forecast model tendencies and more. These products are not parsed.
Forecast/Adivsory (fstadv) - This data-rich product lists the current location of the cyclone, its wind structure, forecast and forecast wind structure.
Public Advisory (public) - These are general text statements issued for the public-at-large. Information in these products is a summary of the Forecast/Advisory product along with any watches and warnings issued, changed, or cancelled. Public Advisory products are the only regularly-scheduled product that may be issued intermittently (every three hours and, occasionally, every two hours) when watches and warnings are in effect. These products are not parsed.
Wind Speed Probabilities (wndprb) - These products list the probability of a minimum sustained wind speed expected in a given forecast window. This product replaces the Strike Probabilities product beginning in 2006 (see below).
Updates (update) - Tropical Cyclone Updates may be issued at any time if a storm is an immediate threat to land or if the cyclone undergoes a significant change of strength or structure. The information in this product is general. These products are not parsed.
Discontinued Products
Strike Probabilities (prblty) - List the probability of a tropical cyclone passing within 65 nautical miles of a location within a forecast window. Replaced in 2006 by the Wind Speed Probabilities product.
Position Estimates (posest) - Typically issued as a storm is threatening land but generally rare (see Hurricane Ike 2008, Key AL092008). It is generally just an update of the current location of the cyclone. After the 2011 hurricane season, this product was discontinued; Updates are now issued in their place. These products are not parsed.
Primary Key
Every cyclone has a Key. However, not all products contain this value (prblty, for example). Products issued during and after the 2005 hurricane season contain this variable.
Use Key to tie datasets together. If Key does not exist, you will need to use a combination of Name and Date, depending on your requirements. Keep in mind that, unless a name is retired, names are recycled every seven years. For example, there are multiple cyclones named Katrina but you may want to isolate on Katrina, 2005.
Installation
rrricanes will not be submitted to CRAN until prior to the hurricane season, 2018. It can be installed via github using devtools:
devtools::install_github("ropensci/rrricanes", build_vignettes = TRUE)
Optional Supporting Packages
rrricanesdata uses a drat repository to host the large, pre-processed datasets.
install.packages("rrricanesdata",
                 repos = "https://timtrice.github.io/drat/",
                 type = "source")
To use high resolution tracking charts, you may also wish to install the `rnaturalearthhires’ package:
install.packages("rnaturalearthhires",
                 repos = "http://packages.ropensci.org",
                 type = "source")
Linux users may also need to install:
libgdal-devlibproj-devlibxml2-dev
Get a List of Storms
We start exploring rrricanes by finding a storm (or storms) we wish to analyze. For this, we use get_storms. There are two optional parameters:
An empty call to the function will return storms for both the Atlantic and East Pacific basin for the current year.
library(dplyr)
library(rrricanes)
get_storms() %>% print(n = nrow(.))
## # A tibble: 33 x 4
##     Year                           Name Basin
##    <dbl>                          <chr> <chr>
##  1  2017          Tropical Storm Arlene    AL
##  2  2017            Tropical Storm Bret    AL
##  3  2017           Tropical Storm Cindy    AL
##  4  2017       Tropical Depression Four    AL
##  5  2017             Tropical Storm Don    AL
##  6  2017           Tropical Storm Emily    AL
##  7  2017             Hurricane Franklin    AL
##  8  2017                 Hurricane Gert    AL
##  9  2017               Hurricane Harvey    AL
## 10  2017 Potential Tropical Cyclone Ten    AL
## 11  2017                 Hurricane Irma    AL
## 12  2017                 Hurricane Jose    AL
## 13  2017                Hurricane Katia    AL
## 14  2017                  Hurricane Lee    AL
## 15  2017                Hurricane Maria    AL
## 16  2017          Tropical Storm Adrian    EP
## 17  2017         Tropical Storm Beatriz    EP
## 18  2017          Tropical Storm Calvin    EP
## 19  2017                 Hurricane Dora    EP
## 20  2017               Hurricane Eugene    EP
## 21  2017             Hurricane Fernanda    EP
## 22  2017            Tropical Storm Greg    EP
## 23  2017    Tropical Depression Eight-E    EP
## 24  2017               Hurricane Hilary    EP
## 25  2017                Hurricane Irwin    EP
## 26  2017   Tropical Depression Eleven-E    EP
## 27  2017            Tropical Storm Jova    EP
## 28  2017              Hurricane Kenneth    EP
## 29  2017           Tropical Storm Lidia    EP
## 30  2017                 Hurricane Otis    EP
## 31  2017                  Hurricane Max    EP
## 32  2017                Hurricane Norma    EP
## 33  2017           Tropical Storm Pilar    EP
## # ... with 1 more variables: Link <chr>
Function get_storms returns four variables:
Year - year of the cyclone.
Name - name of the cyclone.
Basin - basin the cyclone developed (AL for Atlantic, EP for east Pacific).
Link - URL to the cyclone’s archive page.
The variables Name and Link are the only variables that could potentially change. For example, you’ll notice a Name value of Potential Tropical Cyclone Ten. If this storm became a tropical storm then it would receive a new name and the link to the archive page would change as well.
For this example we will explore Hurricane Harvey.
Text Products
Current Data
Once we have identified the storms we want to retrieve we can begin working on getting the products. In the earlier discussion of the available products, recall I used abbreviations such as discus, fstadv, etc. These are the terms we will use when obtaining data.
The easiest method to getting storm data is the function get_storm_data. This function can take multiple storm archive URLs and return multiple datasets within a list.
ds <- get_storms() %>%
  filter(Name == "Hurricane Harvey") %>%
  pull(Link) %>%
  get_storm_data(products = c("discus", "fstadv"))
This process may take some time (particularly, fstadv products). This is because the NHC website allows no more than 80 connections every 10 seconds. rrricanes processes four links every half second.
rrricanes uses the dplyr progress bar to keep you informed of the status. You can turn this off by setting option dplyr.show_progress to FALSE.
An additional option is rrricanes.working_msg; FALSE by default. This option will show a message for each advisory currently being worked. I primarily added it to help find products causing problems but you may find it useful at some point.
At this point, we have a list - ds - of dataframes. Each dataframe is named after the product.
names(ds)
## [1] "discus" "fstadv"
discus is one of the products that isn’t parsed; the full text of the product is returned.
str(ds$discus)
## Classes 'tbl_df', 'tbl' and 'data.frame':	43 obs. of  6 variables:
##  $ Status  : chr  "Potential Tropical Cyclone" "Tropical Storm" "Tropical Storm" "Tropical Storm" ...
##  $ Name    : chr  "Nine" "Harvey" "Harvey" "Harvey" ...
##  $ Adv     : num  1 2 3 4 5 6 7 8 9 10 ...
##  $ Date    : POSIXct, format: "2017-08-17 15:00:00" "2017-08-17 21:00:00" ...
##  $ Key     : chr  "AL092017" "AL092017" "AL092017" "AL092017" ...
##  $ Contents: chr  "\nZCZC MIATCDAT4 ALL\nTTAA00 KNHC DDHHMM\n\nPotential Tropical Cyclone Nine Discussion Number   1\nNWS National"| __truncated__ "\nZCZC MIATCDAT4 ALL\nTTAA00 KNHC DDHHMM\n\nTropical Storm Harvey Discussion Number   2\nNWS National Hurricane"| __truncated__ "\nZCZC MIATCDAT4 ALL\nTTAA00 KNHC DDHHMM\n\nTropical Storm Harvey Discussion Number   3\nNWS National Hurricane"| __truncated__ "\nZCZC MIATCDAT4 ALL\nTTAA00 KNHC DDHHMM\n\nTropical Storm Harvey Discussion Number   4\nNWS National Hurricane"| __truncated__ ...
The fstadv dataframes, however, are parsed and contain the bulk of the information for the storm.
str(ds$fstadv)
## Classes 'tbl_df', 'tbl' and 'data.frame':	43 obs. of  117 variables:
##  $ Status       : chr  "Potential Tropical Cyclone" "Tropical Storm" "Tropical Storm" "Tropical Storm" ...
##  $ Name         : chr  "Nine" "Harvey" "Harvey" "Harvey" ...
##  $ Adv          : num  1 2 3 4 5 6 7 8 9 10 ...
##  $ Date         : POSIXct, format: "2017-08-17 15:00:00" "2017-08-17 21:00:00" ...
##  $ Key          : chr  "AL092017" "AL092017" "AL092017" "AL092017" ...
##  $ Lat          : num  13.1 13 13 13.1 13.1 13.4 13.7 13.8 13.9 14.1 ...
##  $ Lon          : num  -54.1 -55.8 -57.4 -59.1 -61.3 -62.9 -64.1 -65.9 -68.1 -70 ...
##  $ Wind         : num  30 35 35 35 35 35 35 35 35 30 ...
##  $ Gust         : num  40 45 45 45 45 45 45 45 45 40 ...
##  $ Pressure     : num  1008 1004 1005 1004 1005 ...
##  $ PosAcc       : num  30 30 30 30 30 40 40 30 30 30 ...
##  $ FwdDir       : num  270 270 270 270 270 275 275 275 275 275 ...
##  $ FwdSpeed     : num  15 16 16 16 18 18 16 18 19 19 ...
##  $ Eye          : num  NA NA NA NA NA NA NA NA NA NA ...
##  $ SeasNE       : num  NA 60 60 60 75 150 60 60 45 NA ...
##  $ SeasSE       : num  NA 0 0 0 0 0 0 0 0 NA ...
##  $ SeasSW       : num  NA 0 0 0 0 0 0 0 0 NA ...
##  $ SeasNW       : num  NA 60 60 60 60 60 45 60 45 NA ...
##  $ NE64         : num  NA NA NA NA NA NA NA NA NA NA ...
##  $ SE64         : num  NA NA NA NA NA NA NA NA NA NA ...
##  $ SW64         : num  NA NA NA NA NA NA NA NA NA NA ...
##  $ NW64         : num  NA NA NA NA NA NA NA NA NA NA ...
##  $ NE50         : num  NA NA NA NA NA NA NA NA NA NA ...
##  $ SE50         : num  NA NA NA NA NA NA NA NA NA NA ...
##  $ SW50         : num  NA NA NA NA NA NA NA NA NA NA ...
##  $ NW50         : num  NA NA NA NA NA NA NA NA NA NA ...
##  $ NE34         : num  NA 30 50 50 60 60 60 60 0 NA ...
##  $ SE34         : num  NA 0 0 0 0 0 0 0 0 NA ...
##  $ SW34         : num  NA 0 0 0 0 0 0 0 0 NA ...
##  $ NW34         : num  NA 30 50 50 60 60 60 60 60 NA ...
##  $ Hr12FcstDate : POSIXct, format: "2017-08-18 00:00:00" "2017-08-18 06:00:00" ...
##  $ Hr12Lat      : num  13.1 13.1 13.2 13.2 13.3 13.6 14 14 14.1 14.3 ...
##  $ Hr12Lon      : num  -56.4 -58.3 -59.9 -61.7 -63.8 -65.7 -66.8 -68.7 -70.9 -73 ...
##  $ Hr12Wind     : num  30 35 35 35 35 35 35 35 35 30 ...
##  $ Hr12Gust     : num  40 45 45 45 45 45 45 45 45 40 ...
##  $ Hr12NE64     : num  NA NA NA NA NA NA NA NA NA NA ...
##  $ Hr12SE64     : num  NA NA NA NA NA NA NA NA NA NA ...
##  $ Hr12SW64     : num  NA NA NA NA NA NA NA NA NA NA ...
##  $ Hr12NW64     : num  NA NA NA NA NA NA NA NA NA NA ...
##  $ Hr12NE50     : num  NA NA NA NA NA NA NA NA NA NA ...
##  $ Hr12SE50     : num  NA NA NA NA NA NA NA NA NA NA ...
##  $ Hr12SW50     : num  NA NA NA NA NA NA NA NA NA NA ...
##  $ Hr12NW50     : num  NA NA NA NA NA NA NA NA NA NA ...
##  $ Hr12NE34     : num  NA 30 50 50 60 60 60 60 60 NA ...
##  $ Hr12SE34     : num  NA 0 0 0 0 0 0 0 0 NA ...
##  $ Hr12SW34     : num  NA 0 0 0 0 0 0 0 0 NA ...
##  $ Hr12NW34     : num  NA 30 50 50 60 60 60 60 60 NA ...
##  $ Hr24FcstDate : POSIXct, format: "2017-08-18 12:00:00" "2017-08-18 18:00:00" ...
##  $ Hr24Lat      : num  13.2 13.4 13.6 13.5 13.6 13.9 14.3 14.3 14.4 14.6 ...
##  $ Hr24Lon      : num  -59.8 -61.6 -63.3 -65.2 -67.3 -69.3 -70.4 -72.7 -74.9 -77 ...
##  $ Hr24Wind     : num  35 40 40 40 40 40 40 40 40 35 ...
##  $ Hr24Gust     : num  45 50 50 50 50 50 50 50 50 45 ...
##  $ Hr24NE64     : num  NA NA NA NA NA NA NA NA NA NA ...
##  $ Hr24SE64     : num  NA NA NA NA NA NA NA NA NA NA ...
##  $ Hr24SW64     : num  NA NA NA NA NA NA NA NA NA NA ...
##  $ Hr24NW64     : num  NA NA NA NA NA NA NA NA NA NA ...
##  $ Hr24NE50     : num  NA NA NA NA NA NA NA NA NA NA ...
##  $ Hr24SE50     : num  NA NA NA NA NA NA NA NA NA NA ...
##  $ Hr24SW50     : num  NA NA NA NA NA NA NA NA NA NA ...
##  $ Hr24NW50     : num  NA NA NA NA NA NA NA NA NA NA ...
##  $ Hr24NE34     : num  50 40 50 50 60 60 60 60 60 60 ...
##  $ Hr24SE34     : num  0 0 0 0 30 0 0 0 0 0 ...
##  $ Hr24SW34     : num  0 0 0 0 30 0 0 0 0 0 ...
##  $ Hr24NW34     : num  50 40 50 50 60 60 60 60 60 60 ...
##  $ Hr36FcstDate : POSIXct, format: "2017-08-19 00:00:00" "2017-08-19 06:00:00" ...
##  $ Hr36Lat      : num  13.5 13.7 13.9 13.9 14 14.2 14.5 14.6 14.9 15.2 ...
##  $ Hr36Lon      : num  -63.2 -65.1 -67 -68.8 -71.1 -73 -74.3 -76.7 -78.7 -80.5 ...
##  $ Hr36Wind     : num  40 45 45 40 40 40 40 45 45 40 ...
##  $ Hr36Gust     : num  50 55 55 50 50 50 50 55 55 50 ...
##  $ Hr36NE64     : num  NA NA NA NA NA NA NA NA NA NA ...
##  $ Hr36SE64     : num  NA NA NA NA NA NA NA NA NA NA ...
##  $ Hr36SW64     : num  NA NA NA NA NA NA NA NA NA NA ...
##  $ Hr36NW64     : num  NA NA NA NA NA NA NA NA NA NA ...
##  $ Hr36NE50     : num  NA NA NA NA NA NA NA NA NA NA ...
##  $ Hr36SE50     : num  NA NA NA NA NA NA NA NA NA NA ...
##  $ Hr36SW50     : num  NA NA NA NA NA NA NA NA NA NA ...
##  $ Hr36NW50     : num  NA NA NA NA NA NA NA NA NA NA ...
##  $ Hr36NE34     : num  60 60 60 60 60 60 60 70 70 60 ...
##  $ Hr36SE34     : num  0 30 30 30 30 0 0 0 0 0 ...
##  $ Hr36SW34     : num  0 30 30 30 30 0 0 0 0 0 ...
##  $ Hr36NW34     : num  60 60 60 60 60 60 60 70 70 60 ...
##  $ Hr48FcstDate : POSIXct, format: "2017-08-19 12:00:00" "2017-08-19 18:00:00" ...
##  $ Hr48Lat      : num  13.9 14 14.1 14.1 14.3 14.5 14.8 15.2 15.7 16 ...
##  $ Hr48Lon      : num  -66.7 -68.8 -70.9 -72.7 -75 -76.7 -78.1 -80.1 -82.4 -83.8 ...
##  $ Hr48Wind     : num  45 45 50 50 50 45 45 50 50 45 ...
##  $ Hr48Gust     : num  55 55 60 60 60 55 55 60 60 55 ...
##  $ Hr48NE50     : num  NA NA 30 30 30 NA NA 30 30 NA ...
##  $ Hr48SE50     : num  NA NA 0 0 0 NA NA 0 0 NA ...
##  $ Hr48SW50     : num  NA NA 0 0 0 NA NA 0 0 NA ...
##  $ Hr48NW50     : num  NA NA 30 30 30 NA NA 30 30 NA ...
##  $ Hr48NE34     : num  60 60 60 60 70 60 60 90 90 70 ...
##  $ Hr48SE34     : num  30 30 30 30 30 30 0 50 50 0 ...
##  $ Hr48SW34     : num  30 30 30 30 30 30 0 40 40 0 ...
##  $ Hr48NW34     : num  60 60 60 60 70 60 60 70 70 70 ...
##  $ Hr72FcstDate : POSIXct, format: "2017-08-20 12:00:00" "2017-08-20 18:00:00" ...
##  $ Hr72Lat      : num  14.5 14.5 14.8 15 15 15.5 16.5 17 17.5 18 ...
##  $ Hr72Lon      : num  -74.5 -76.5 -78.6 -80.2 -82 -83.5 -84.7 -86.5 -88 -89 ...
##  $ Hr72Wind     : num  55 55 60 60 60 60 55 55 60 45 ...
##  $ Hr72Gust     : num  65 65 75 75 75 75 65 65 75 55 ...
##   [list output truncated]
Each product can also be accessed on its own. For example, if you only wish to view discus products, use the get_discus function. fstadv products can be accessed with get_fstadv. Every products specific function is preceeded by get_.
To understand the variable definitions, access the help file for each of these functions (i.e., ?get_fstadv). They contain full definitions on the variables and their purpose.
As you can see, the fstadv dataframe is very wide. There may be instances you only want to focus on specific pieces of the product. I’ve developed tidy functions to help trim these datasets:
tidy_fcst
tidy_fcst_wr
tidy_fstadv
tidy_wr
These datasets exist in rrricanesdata as fcst, fcst_wr, adv, and wr, respectively (see below).
Most tropical cyclone forecast/advisory products will contain multiple forecast points. Initially, only three-day forecasts were issued. Beginning the with the 2003 season, 96 hour (five-day) forecasts were issued.
If a storm is not expected to survive the full forecast period, then only relevant forecasts will be issued.
We use tidy_fcst to return these forecast points in a tidy fashion from fstadv.
str(tidy_fcst(ds$fstadv))
## Classes 'tbl_df', 'tbl' and 'data.frame':	283 obs. of  8 variables:
##  $ Key     : chr  "AL092017" "AL092017" "AL092017" "AL092017" ...
##  $ Adv     : num  1 1 1 1 1 1 1 2 2 2 ...
##  $ Date    : POSIXct, format: "2017-08-17 15:00:00" "2017-08-17 15:00:00" ...
##  $ FcstDate: POSIXct, format: "2017-08-18 00:00:00" "2017-08-18 12:00:00" ...
##  $ Lat     : num  13.1 13.2 13.5 13.9 14.5 15.5 17 13.1 13.4 13.7 ...
##  $ Lon     : num  -56.4 -59.8 -63.2 -66.7 -74.5 -82 -87.5 -58.3 -61.6 -65.1 ...
##  $ Wind    : num  30 35 40 45 55 65 65 35 40 45 ...
##  $ Gust    : num  40 45 50 55 65 80 80 45 50 55 ...
Wind radius values are issued with parameters of 34, 50 and 64. These values are the radius to which minimum one-minute sustained winds can be expected or exist.
A tropical depression will not have associated wind radius values since the maximum winds of a depression are 30 knots. If a tropical storm has winds less than 50 knots, then it will only have wind radius values for the 34-knot wind field. If winds are greater than 50 knots, then it will have wind radius values for 34 and 50 knot winds. A hurricane will have all wind radius fields.
Wind radius values are further seperated by quadrant; NE (northeast), SE, SW and NW. Not all quadrants will have values; particularly if the cyclone is struggling to organize. For example, you will often find a minimal hurricane only has hurricane-force winds (64 knots) in the northeast quadrant.
When appropriate, a forecast/advisory product will contain these values for the current position and for each forecast position. Use tidy_wr and tidy_fcst_wr, respectively, for these variables.
str(tidy_wr(ds$fstadv))
## Classes 'tbl_df', 'tbl' and 'data.frame':	56 obs. of  8 variables:
##  $ Key      : chr  "AL092017" "AL092017" "AL092017" "AL092017" ...
##  $ Adv      : num  2 3 4 5 6 7 8 9 15 16 ...
##  $ Date     : POSIXct, format: "2017-08-17 21:00:00" "2017-08-18 03:00:00" ...
##  $ WindField: num  34 34 34 34 34 34 34 34 34 34 ...
##  $ NE       : num  30 50 50 60 60 60 60 0 100 80 ...
##  $ SE       : num  0 0 0 0 0 0 0 0 0 30 ...
##  $ SW       : num  0 0 0 0 0 0 0 0 0 20 ...
##  $ NW       : num  30 50 50 60 60 60 60 60 50 50 ...
str(tidy_fcst_wr(ds$fstadv))
## Classes 'tbl_df', 'tbl' and 'data.frame':	246 obs. of  9 variables:
##  $ Key      : chr  "AL092017" "AL092017" "AL092017" "AL092017" ...
##  $ Adv      : num  1 1 1 1 1 2 2 2 2 2 ...
##  $ Date     : POSIXct, format: "2017-08-17 15:00:00" "2017-08-17 15:00:00" ...
##  $ FcstDate : POSIXct, format: "2017-08-18 12:00:00" "2017-08-19 00:00:00" ...
##  $ WindField: num  34 34 34 34 50 34 34 34 34 34 ...
##  $ NE       : num  50 60 60 80 30 30 40 60 60 80 ...
##  $ SE       : num  0 0 30 40 0 0 0 30 30 40 ...
##  $ SW       : num  0 0 30 40 0 0 0 30 30 40 ...
##  $ NW       : num  50 60 60 80 30 30 40 60 60 80 ...
Lastly, you may only want to focus on current storm details. For this, we use tidy_fstadv:
str(tidy_fstadv(ds$fstadv))
## Classes 'tbl_df', 'tbl' and 'data.frame':	43 obs. of  18 variables:
##  $ Key     : chr  "AL092017" "AL092017" "AL092017" "AL092017" ...
##  $ Adv     : num  1 2 3 4 5 6 7 8 9 10 ...
##  $ Date    : POSIXct, format: "2017-08-17 15:00:00" "2017-08-17 21:00:00" ...
##  $ Status  : chr  "Potential Tropical Cyclone" "Tropical Storm" "Tropical Storm" "Tropical Storm" ...
##  $ Name    : chr  "Nine" "Harvey" "Harvey" "Harvey" ...
##  $ Lat     : num  13.1 13 13 13.1 13.1 13.4 13.7 13.8 13.9 14.1 ...
##  $ Lon     : num  -54.1 -55.8 -57.4 -59.1 -61.3 -62.9 -64.1 -65.9 -68.1 -70 ...
##  $ Wind    : num  30 35 35 35 35 35 35 35 35 30 ...
##  $ Gust    : num  40 45 45 45 45 45 45 45 45 40 ...
##  $ Pressure: num  1008 1004 1005 1004 1005 ...
##  $ PosAcc  : num  30 30 30 30 30 40 40 30 30 30 ...
##  $ FwdDir  : num  270 270 270 270 270 275 275 275 275 275 ...
##  $ FwdSpeed: num  15 16 16 16 18 18 16 18 19 19 ...
##  $ Eye     : num  NA NA NA NA NA NA NA NA NA NA ...
##  $ SeasNE  : num  NA 60 60 60 75 150 60 60 45 NA ...
##  $ SeasSE  : num  NA 0 0 0 0 0 0 0 0 NA ...
##  $ SeasSW  : num  NA 0 0 0 0 0 0 0 0 NA ...
##  $ SeasNW  : num  NA 60 60 60 60 60 45 60 45 NA ...
In release 0.2.1, tidy_fstadv will be renamed to tidy_adv.
One final note on the data: all speed variables are measured in knots, distance variables in nautical miles, and pressure variables in millibars. Functions knots_to_mph and mb_to_in are available for speed/pressure conversions. Function nm_to_sm to convert nautical miles to survey miles will be included in release 0.2.1.
Archived Data
rrricanesdata was built to make it easier to get pre-processed datasets. As mentioned earlier, rrricanesdata will be updated the first of every month if any advisory was issued for the previous month. (As I am now writing this portion in September, all of Hurricane Harvey’s advisories - the last one issued the morning of August 31 - exist in rrricanesdata release 0.0.1.4.)
As with rrricanes, rrricanesdata is not available in CRAN (nor will be due to size limitations).
I’ll load all datasets with the call:
library(rrricanesdata)
data(list = data(package = "rrricanesdata")$results[,3])
All core product datasets are available. The dataframes adv, fcst, fcst_wr and wr are the dataframes created by tidy_fstadv, tidy_fcst, tidy_fcst_wr and tidy_wr, respectively.
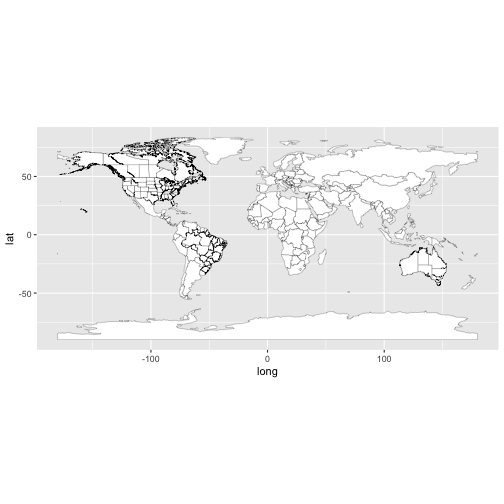
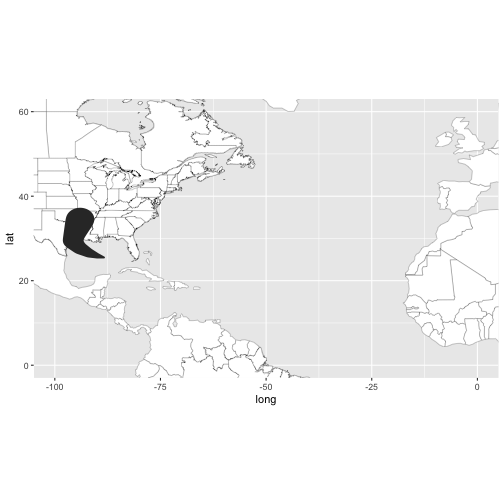
Tracking Charts
rrricanes also comes with helper functions to quickly generate tracking charts. These charts use rnaturalearthdata (for high resolution maps, use package rnaturalearthhires). These charts are not required - Bob Rudis demonstrates demonstrates succintly - so feel free to experiment.
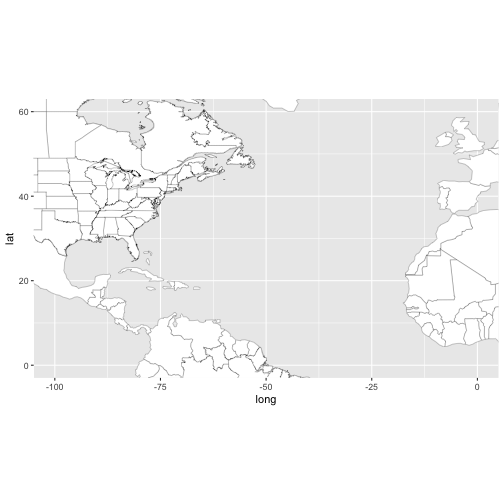
You can generate a default plot for the entire globe with tracking_chart:
tracking_chart()
![]()
You may find this handy when examining cyclones that cross basins (from the Atlantic to east Pacific such as Hurricane Otto, 2016).
tracking_chart takes three parameters (in addition to dots for other ggplot calls):
countries - By default, show country borders
states - By default, show state borders
res - resolution; default is 110nm.
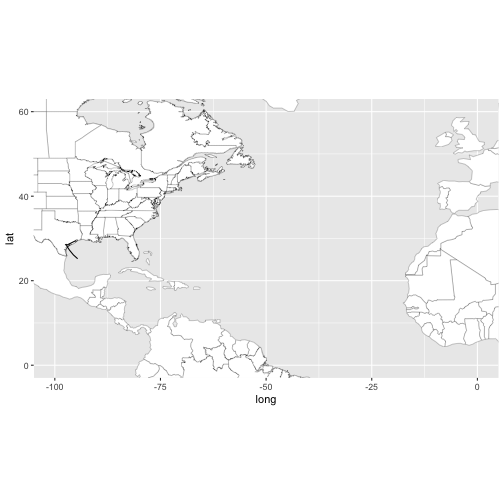
We do not see countries and states in the map above because of the ggplot defaults. Let’s try it again:
tracking_chart(color = "black", size = 0.1, fill = "white")
![]()
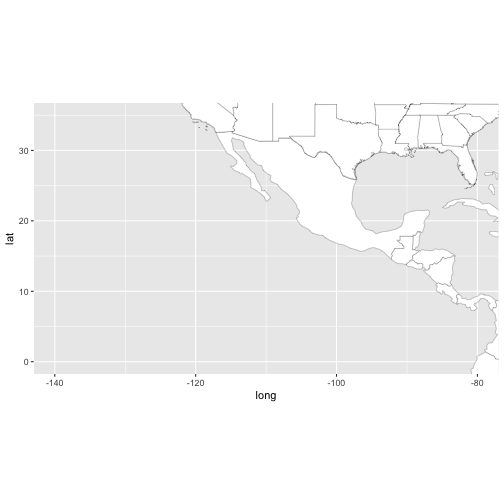
We can “zoom in” on each basin with helper functions al_tracking_chart and ep_tracking_chart:
al_tracking_chart(color = "black", size = 0.1, fill = "white")
![]()
ep_tracking_chart(color = "black", size = 0.1, fill = "white")
![]()
GIS Data
GIS data exists for some cyclones and varies by year. This is a relatively new archive by the NHC and is inconsistent from storm to storm.
The “gis” functions are as follows:
gis_advisory
gis_latest
gis_prob_storm_surge
gis_windfield
gis_wsp
Another area of inconsistency with these products is how they are organized. For example, gis_advisory, gis_prob_storm_surge and gis_windfield can be retrieved with a storm Key (unique identifier for every cyclone; see fstadv$Key). Except for gis_prob_storm_surge, you can even pass an advisory number (see fstadv$Adv).
gis_wsp requires a datetime value; to access a specific GIS package for a storm’s advisory you would need to use a variable such as fstadv$Date, subtract three hours and convert to “%Y%m%d%H” format (“%m”, “%d”, and “%H” are optional).
All above functions only return URL’s to their respective datasets. This was done to allow you to validate the quantity of datasets you wish to retrieve as, in some cases, the dataset may not exist at all or there may be several available. Use gis_download with the requested URL’s to retrieve your datasets.
Let’s go through each of these. First, let’s get the Key of Hurricane Harvey:
# Remember that ds already and only contains data for Hurricane Harvey
key <- ds$fstadv %>% pull(Key) %>% first()
gis_advisory
gis_advisory returns a dataset package containing past and forecast plot points and lines, a forecast cone (area representing where the cyclone could track), wind radius data and current watches and warnings.
gis_advisory takes two parameters:
If we leave out advisory we get all related datasets for Hurricane Harvey:
x <- gis_advisory(key = key)
length(x)
## [1] 77
head(x, n = 5L)
## [1] "http://www.nhc.noaa.gov/gis/forecast/archive/al092017_5day_001.zip"
## [2] "http://www.nhc.noaa.gov/gis/forecast/archive/al092017_5day_001A.zip"
## [3] "http://www.nhc.noaa.gov/gis/forecast/archive/al092017_5day_002.zip"
## [4] "http://www.nhc.noaa.gov/gis/forecast/archive/al092017_5day_002A.zip"
## [5] "http://www.nhc.noaa.gov/gis/forecast/archive/al092017_5day_003.zip"
As you can see, there is quite a bit (and why the core gis functions only return URLs rather than the actual datasets). Let’s trim this down a bit. Sneaking a peek (cheating) I find advisory 19 seems a good choice.
gis_advisory(key = key, advisory = 19)
## [1] "http://www.nhc.noaa.gov/gis/forecast/archive/al092017_5day_019.zip"
Good; there is a data package available for this advisory. Once you have confirmed the package you want to retrieve, use gis_download to get the data.
gis <- gis_advisory(key = key, advisory = 19) %>%
  gis_download()
## OGR data source with driver: ESRI Shapefile
## Source: "/var/folders/gs/4khph0xs0436gmd2gdnwsg080000gn/T//Rtmp1wYg2x", layer: "al092017-019_5day_lin"
## with 1 features
## It has 7 fields
## OGR data source with driver: ESRI Shapefile
## Source: "/var/folders/gs/4khph0xs0436gmd2gdnwsg080000gn/T//Rtmp1wYg2x", layer: "al092017-019_5day_pgn"
## with 1 features
## It has 7 fields
## OGR data source with driver: ESRI Shapefile
## Source: "/var/folders/gs/4khph0xs0436gmd2gdnwsg080000gn/T//Rtmp1wYg2x", layer: "al092017-019_5day_pts"
## with 8 features
## It has 23 fields
## OGR data source with driver: ESRI Shapefile
## Source: "/var/folders/gs/4khph0xs0436gmd2gdnwsg080000gn/T//Rtmp1wYg2x", layer: "al092017-019_ww_wwlin"
## with 5 features
## It has 8 fields
Let’s see what we have.
str(gis)
## List of 4
##  $ al092017_019_5day_lin:Formal class 'SpatialLinesDataFrame' [package "sp"] with 4 slots
##   .. ..@ data       :'data.frame':	1 obs. of  7 variables:
##   .. .. ..$ STORMNAME: chr "Harvey"
##   .. .. ..$ STORMTYPE: chr "HU"
##   .. .. ..$ ADVDATE  : chr "1000 PM CDT Thu Aug 24 2017"
##   .. .. ..$ ADVISNUM : chr "19"
##   .. .. ..$ STORMNUM : num 9
##   .. .. ..$ FCSTPRD  : num 120
##   .. .. ..$ BASIN    : chr "AL"
##   .. ..@ lines      :List of 1
##   .. .. ..$ :Formal class 'Lines' [package "sp"] with 2 slots
##   .. .. .. .. ..@ Lines:List of 1
##   .. .. .. .. .. ..$ :Formal class 'Line' [package "sp"] with 1 slot
##   .. .. .. .. .. .. .. ..@ coords: num [1:8, 1:2] -94.6 -95.6 -96.5 -97.1 -97.3 -97.5 -97 -95 25.2 26.1 ...
##   .. .. .. .. ..@ ID   : chr "0"
##   .. ..@ bbox       : num [1:2, 1:2] -97.5 25.2 -94.6 29.5
##   .. .. ..- attr(*, "dimnames")=List of 2
##   .. .. .. ..$ : chr [1:2] "x" "y"
##   .. .. .. ..$ : chr [1:2] "min" "max"
##   .. ..@ proj4string:Formal class 'CRS' [package "sp"] with 1 slot
##   .. .. .. ..@ projargs: chr "+proj=longlat +a=6371200 +b=6371200 +no_defs"
##  $ al092017_019_5day_pgn:Formal class 'SpatialPolygonsDataFrame' [package "sp"] with 5 slots
##   .. ..@ data       :'data.frame':	1 obs. of  7 variables:
##   .. .. ..$ STORMNAME: chr "Harvey"
##   .. .. ..$ STORMTYPE: chr "HU"
##   .. .. ..$ ADVDATE  : chr "1000 PM CDT Thu Aug 24 2017"
##   .. .. ..$ ADVISNUM : chr "19"
##   .. .. ..$ STORMNUM : num 9
##   .. .. ..$ FCSTPRD  : num 120
##   .. .. ..$ BASIN    : chr "AL"
##   .. ..@ polygons   :List of 1
##   .. .. ..$ :Formal class 'Polygons' [package "sp"] with 5 slots
##   .. .. .. .. ..@ Polygons :List of 1
##   .. .. .. .. .. ..$ :Formal class 'Polygon' [package "sp"] with 5 slots
##   .. .. .. .. .. .. .. ..@ labpt  : num [1:2] -95.4 29.2
##   .. .. .. .. .. .. .. ..@ area   : num 51.7
##   .. .. .. .. .. .. .. ..@ hole   : logi FALSE
##   .. .. .. .. .. .. .. ..@ ringDir: int 1
##   .. .. .. .. .. .. .. ..@ coords : num [1:1482, 1:2] -94.6 -94.7 -94.7 -94.7 -94.7 ...
##   .. .. .. .. ..@ plotOrder: int 1
##   .. .. .. .. ..@ labpt    : num [1:2] -95.4 29.2
##   .. .. .. .. ..@ ID       : chr "0"
##   .. .. .. .. ..@ area     : num 51.7
##   .. ..@ plotOrder  : int 1
##   .. ..@ bbox       : num [1:2, 1:2] -100 24.9 -91 33
##   .. .. ..- attr(*, "dimnames")=List of 2
##   .. .. .. ..$ : chr [1:2] "x" "y"
##   .. .. .. ..$ : chr [1:2] "min" "max"
##   .. ..@ proj4string:Formal class 'CRS' [package "sp"] with 1 slot
##   .. .. .. ..@ projargs: chr "+proj=longlat +a=6371200 +b=6371200 +no_defs"
##  $ al092017_019_5day_pts:Formal class 'SpatialPointsDataFrame' [package "sp"] with 5 slots
##   .. ..@ data       :'data.frame':	8 obs. of  23 variables:
##   .. .. ..$ ADVDATE  : chr [1:8] "1000 PM CDT Thu Aug 24 2017" "1000 PM CDT Thu Aug 24 2017" "1000 PM CDT Thu Aug 24 2017" "1000 PM CDT Thu Aug 24 2017" ...
##   .. .. ..$ ADVISNUM : chr [1:8] "19" "19" "19" "19" ...
##   .. .. ..$ BASIN    : chr [1:8] "AL" "AL" "AL" "AL" ...
##   .. .. ..$ DATELBL  : chr [1:8] "10:00 PM Thu" "7:00 AM Fri" "7:00 PM Fri" "7:00 AM Sat" ...
##   .. .. ..$ DVLBL    : chr [1:8] "H" "H" "M" "M" ...
##   .. .. ..$ FCSTPRD  : num [1:8] 120 120 120 120 120 120 120 120
##   .. .. ..$ FLDATELBL: chr [1:8] "2017-08-24 7:00 PM Thu CDT" "2017-08-25 7:00 AM Fri CDT" "2017-08-25 7:00 PM Fri CDT" "2017-08-26 7:00 AM Sat CDT" ...
##   .. .. ..$ GUST     : num [1:8] 90 115 135 120 85 45 45 45
##   .. .. ..$ LAT      : num [1:8] 25.2 26.1 27.2 28.1 28.6 28.5 28.5 29.5
##   .. .. ..$ LON      : num [1:8] -94.6 -95.6 -96.5 -97.1 -97.3 -97.5 -97 -95
##   .. .. ..$ MAXWIND  : num [1:8] 75 95 110 100 70 35 35 35
##   .. .. ..$ MSLP     : num [1:8] 973 9999 9999 9999 9999 ...
##   .. .. ..$ SSNUM    : num [1:8] 1 2 3 3 1 0 0 0
##   .. .. ..$ STORMNAME: chr [1:8] "Hurricane Harvey" "Hurricane Harvey" "Hurricane Harvey" "Hurricane Harvey" ...
##   .. .. ..$ STORMNUM : num [1:8] 9 9 9 9 9 9 9 9
##   .. .. ..$ STORMSRC : chr [1:8] "Tropical Cyclone" "Tropical Cyclone" "Tropical Cyclone" "Tropical Cyclone" ...
##   .. .. ..$ STORMTYPE: chr [1:8] "HU" "HU" "MH" "MH" ...
##   .. .. ..$ TCDVLP   : chr [1:8] "Hurricane" "Hurricane" "Major Hurricane" "Major Hurricane" ...
##   .. .. ..$ TAU      : num [1:8] 0 12 24 36 48 72 96 120
##   .. .. ..$ TCDIR    : num [1:8] 315 9999 9999 9999 9999 ...
##   .. .. ..$ TCSPD    : num [1:8] 9 9999 9999 9999 9999 ...
##   .. .. ..$ TIMEZONE : chr [1:8] "CDT" "CDT" "CDT" "CDT" ...
##   .. .. ..$ VALIDTIME: chr [1:8] "25/0000" "25/1200" "26/0000" "26/1200" ...
##   .. ..@ coords.nrs : num(0)
##   .. ..@ coords     : num [1:8, 1:2] -94.6 -95.6 -96.5 -97.1 -97.3 -97.5 -97 -95 25.2 26.1 ...
##   .. .. ..- attr(*, "dimnames")=List of 2
##   .. .. .. ..$ : NULL
##   .. .. .. ..$ : chr [1:2] "coords.x1" "coords.x2"
##   .. ..@ bbox       : num [1:2, 1:2] -97.5 25.2 -94.6 29.5
##   .. .. ..- attr(*, "dimnames")=List of 2
##   .. .. .. ..$ : chr [1:2] "coords.x1" "coords.x2"
##   .. .. .. ..$ : chr [1:2] "min" "max"
##   .. ..@ proj4string:Formal class 'CRS' [package "sp"] with 1 slot
##   .. .. .. ..@ projargs: chr "+proj=longlat +a=6371200 +b=6371200 +no_defs"
##  $ al092017_019_ww_wwlin:Formal class 'SpatialLinesDataFrame' [package "sp"] with 4 slots
##   .. ..@ data       :'data.frame':	5 obs. of  8 variables:
##   .. .. ..$ STORMNAME: chr [1:5] "Harvey" "Harvey" "Harvey" "Harvey" ...
##   .. .. ..$ STORMTYPE: chr [1:5] "HU" "HU" "HU" "HU" ...
##   .. .. ..$ ADVDATE  : chr [1:5] "1000 PM CDT Thu Aug 24 2017" "1000 PM CDT Thu Aug 24 2017" "1000 PM CDT Thu Aug 24 2017" "1000 PM CDT Thu Aug 24 2017" ...
##   .. .. ..$ ADVISNUM : chr [1:5] "19" "19" "19" "19" ...
##   .. .. ..$ STORMNUM : num [1:5] 9 9 9 9 9
##   .. .. ..$ FCSTPRD  : num [1:5] 120 120 120 120 120
##   .. .. ..$ BASIN    : chr [1:5] "AL" "AL" "AL" "AL" ...
##   .. .. ..$ TCWW     : chr [1:5] "TWA" "HWA" "TWR" "TWR" ...
##   .. ..@ lines      :List of 5
##   .. .. ..$ :Formal class 'Lines' [package "sp"] with 2 slots
##   .. .. .. .. ..@ Lines:List of 1
##   .. .. .. .. .. ..$ :Formal class 'Line' [package "sp"] with 1 slot
##   .. .. .. .. .. .. .. ..@ coords: num [1:3, 1:2] -97.7 -97.4 -97.2 24.3 25.2 ...
##   .. .. .. .. ..@ ID   : chr "0"
##   .. .. ..$ :Formal class 'Lines' [package "sp"] with 2 slots
##   .. .. .. .. ..@ Lines:List of 1
##   .. .. .. .. .. ..$ :Formal class 'Line' [package "sp"] with 1 slot
##   .. .. .. .. .. .. .. ..@ coords: num [1:3, 1:2] -97.2 -97.2 -97.3 26 26.1 ...
##   .. .. .. .. ..@ ID   : chr "1"
##   .. .. ..$ :Formal class 'Lines' [package "sp"] with 2 slots
##   .. .. .. .. ..@ Lines:List of 1
##   .. .. .. .. .. ..$ :Formal class 'Line' [package "sp"] with 1 slot
##   .. .. .. .. .. .. .. ..@ coords: num [1:3, 1:2] -97.2 -97.2 -97.3 26 26.1 ...
##   .. .. .. .. ..@ ID   : chr "2"
##   .. .. ..$ :Formal class 'Lines' [package "sp"] with 2 slots
##   .. .. .. .. ..@ Lines:List of 1
##   .. .. .. .. .. ..$ :Formal class 'Line' [package "sp"] with 1 slot
##   .. .. .. .. .. .. .. ..@ coords: num [1:10, 1:2] -95.6 -95.3 -95.1 -95.1 -94.8 ...
##   .. .. .. .. ..@ ID   : chr "3"
##   .. .. ..$ :Formal class 'Lines' [package "sp"] with 2 slots
##   .. .. .. .. ..@ Lines:List of 1
##   .. .. .. .. .. ..$ :Formal class 'Line' [package "sp"] with 1 slot
##   .. .. .. .. .. .. .. ..@ coords: num [1:16, 1:2] -97.3 -97.3 -97.3 -97.4 -97.4 ...
##   .. .. .. .. ..@ ID   : chr "4"
##   .. ..@ bbox       : num [1:2, 1:2] -97.7 24.3 -94.4 29.8
##   .. .. ..- attr(*, "dimnames")=List of 2
##   .. .. .. ..$ : chr [1:2] "x" "y"
##   .. .. .. ..$ : chr [1:2] "min" "max"
##   .. ..@ proj4string:Formal class 'CRS' [package "sp"] with 1 slot
##   .. .. .. ..@ projargs: chr "+proj=longlat +a=6371200 +b=6371200 +no_defs"
We get four spatial dataframes - points, polygons and lines.
names(gis)
## [1] "al092017_019_5day_lin" "al092017_019_5day_pgn" "al092017_019_5day_pts"
## [4] "al092017_019_ww_wwlin"
With the expection of point spatial dataframes (which can be converted to dataframe using tibble::as_data_frame, use helper function shp_to_df to convert the spatial dataframes to dataframes.
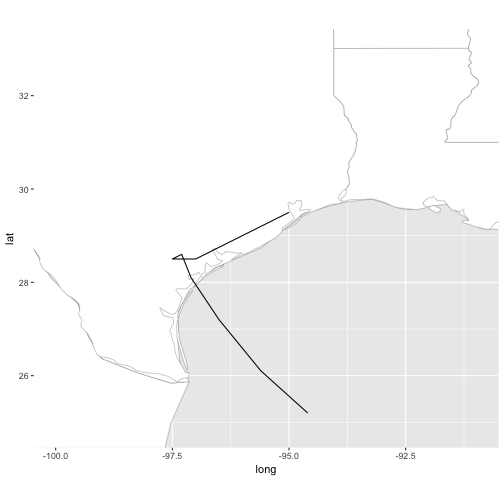
Forecast Track
library(ggplot2)
al_tracking_chart(color = "black", size = 0.1, fill = "white") +
  geom_path(data = shp_to_df(gis$al092017_019_5day_lin), aes(x = long, y = lat))
![]()
Use geom_path instead of geom_line to keep the positions in order.
You can “zoom in” even further using ggplot2::coord_equal. For that, we need to know the limits of our objects (minimum and maximum latitude and longitude) or bounding box. Thankfully, the sp package can get us this information with the bbox function.
But, we don’t want to use the “al092017_019_5day_lin” dataset. Our gis dataset contains a forecast cone which expands well beyond the lines dataset. Take a look:
sp::bbox(gis$al092017_019_5day_lin)
##     min   max
## x -97.5 -94.6
## y  25.2  29.5
sp::bbox(gis$al092017_019_5day_pgn)
##          min       max
## x -100.01842 -90.96327
## y   24.86433  33.01644
So, let’s get the bounding box of our forecast cone dataset and zoom in on our map.
bb <- sp::bbox(gis$al092017_019_5day_pgn)
al_tracking_chart(color = "black", size = 0.1, fill = "white") +
  geom_path(data = shp_to_df(gis$al092017_019_5day_lin),
            aes(x = long, y = lat)) +
  coord_equal(xlim = c(bb[1,1], bb[1,2]),
              ylim = c(bb[2,1], bb[2,2]))
![]()
That’s much better. For simplicity I’m going to save the base map, bp, without the line plot.
bp <- al_tracking_chart(color = "black", size = 0.1, fill = "white") +
  coord_equal(xlim = c(bb[1,1], bb[1,2]),
              ylim = c(bb[2,1], bb[2,2]))
Forecast Points
Forecast points identify each forecast position along with forecast winds and date. Remember that for point spatial dataframes you use tibble::as_data_frame rather than sp_to_df.
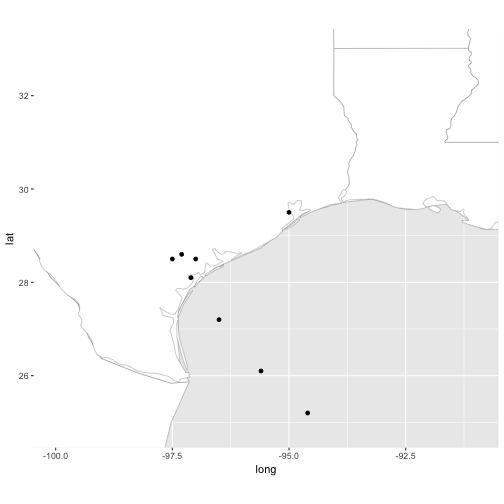
bp +
  geom_point(data = tibble::as_data_frame(gis$al092017_019_5day_pts),
             aes(x = long, y = lat))
If you ran the code above you would get an error.
Error in FUN(X[[i]], ...) : object 'long' not found
Why? The variable long does not exist as it does in other GIS datasets; it is lon. This is one of the inconsistencies I was referring to previously. Additionally, the variables are all uppercase.
names(gis$al092017_019_5day_pts)
##  [1] "ADVDATE"   "ADVISNUM"  "BASIN"     "DATELBL"   "DVLBL"
##  [6] "FCSTPRD"   "FLDATELBL" "GUST"      "LAT"       "LON"
## [11] "MAXWIND"   "MSLP"      "SSNUM"     "STORMNAME" "STORMNUM"
## [16] "STORMSRC"  "STORMTYPE" "TCDVLP"    "TAU"       "TCDIR"
## [21] "TCSPD"     "TIMEZONE"  "VALIDTIME"
Let’s try it again.
bp +
  geom_point(data = tibble::as_data_frame(gis$al092017_019_5day_pts),
             aes(x = LON, y = LAT))
![]()
Better.
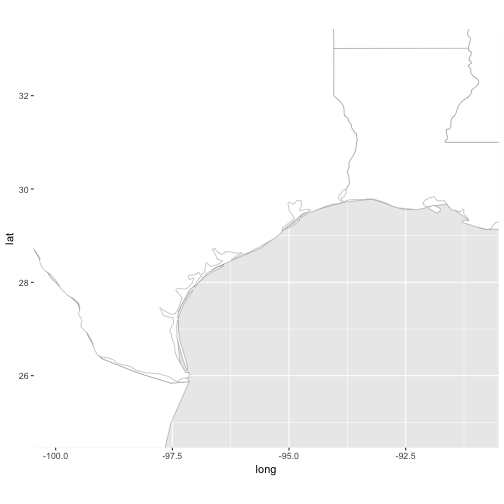
Forecast Cone
A forecast cone identifies the probability of error in a forecast. Forecasting tropical cyclones is tricky business - errors increase the further out a forecast is issued. Theoretically, any area within a forecast cone is at risk of seeing cyclone conditions within the given period of time.
Generally, a forecast cone package contains two subsets: 72-hour forecast cone and 120-hour forecast cone. This is identified in the dataset under the variable FCSTPRD. Let’s take a look at the 72-hour forecast period:
bp +
  geom_polygon(data = shp_to_df(gis$al092017_019_5day_pgn) %>%
                 filter(FCSTPRD == 72),
               aes(x = long, y = lat, color = FCSTPRD))
![]()
Nothing there!
As mentioned earlier, these are experimental products issued by the NHC and they do contain inconsistencies. To demonstrate, I’ll use Hurricane Ike advisory 42.
df <- gis_advisory(key = "AL092008", advisory = 42) %>%
  gis_download()
## OGR data source with driver: ESRI Shapefile
## Source: "/var/folders/gs/4khph0xs0436gmd2gdnwsg080000gn/T//Rtmp1wYg2x", layer: "al092008.042_5day_lin"
## with 2 features
## It has 9 fields
## OGR data source with driver: ESRI Shapefile
## Source: "/var/folders/gs/4khph0xs0436gmd2gdnwsg080000gn/T//Rtmp1wYg2x", layer: "al092008.042_5day_pgn"
## with 2 features
## It has 9 fields
## OGR data source with driver: ESRI Shapefile
## Source: "/var/folders/gs/4khph0xs0436gmd2gdnwsg080000gn/T//Rtmp1wYg2x", layer: "al092008.042_5day_pts"
## with 13 features
## It has 20 fields
## OGR data source with driver: ESRI Shapefile
## Source: "/var/folders/gs/4khph0xs0436gmd2gdnwsg080000gn/T//Rtmp1wYg2x", layer: "al092008.042_ww_wwlin"
## with 5 features
## It has 10 fields
al_tracking_chart(color = "black", size = 0.1, fill = "white") +
  geom_polygon(data = shp_to_df(df$al092008_042_5day_pgn) %>%
                 filter(FCSTPRD == 72),
                  aes(x = long, y = lat))
![]()
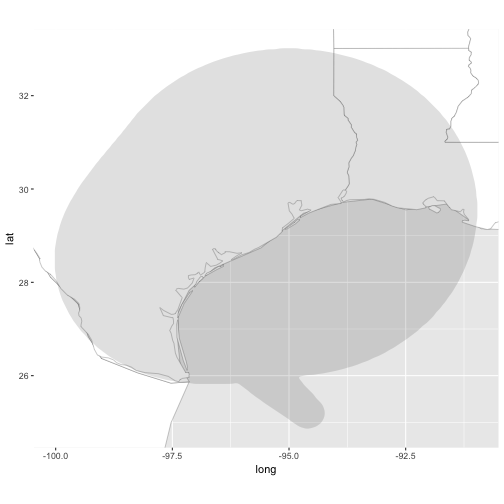
We do, however, have a 120-hour forecast cone for Hurricane Harvey. Let’s go ahead and plot that.
bp +
  geom_polygon(data = gis$al092017_019_5day_pgn,
               aes(x = long, y = lat), alpha = 0.15)
![]()
It’s an odd-looking forecast cone, for sure. But this demonstrates the entire area that Harvey could have potentially traveled.
Watches and Warnings
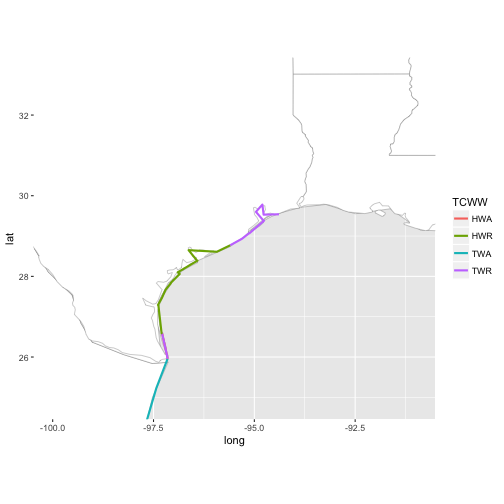
Our last dataset in this package is “al092017_09_ww_wlin”. These are the current watches and warnings in effect. This is a spatial lines dataframe that needs shp_to_df. Again, we use geom_path instead of geom_line. And we want to group our paths by the variable TCWW.
bp +
  geom_path(data = shp_to_df(gis$al092017_019_ww_wwlin),
            aes(x = long, y = lat, group = group, color = TCWW), size = 1)
![]()
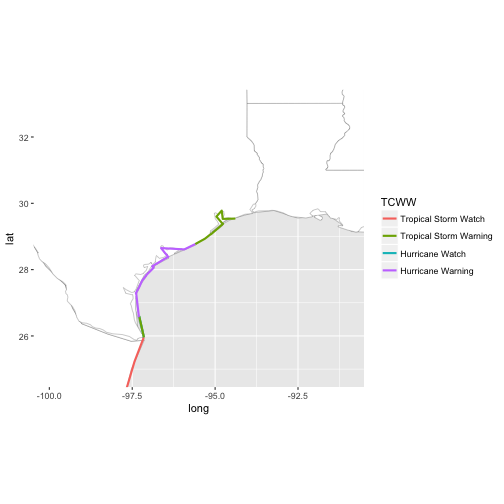
The paths won’t follow our coastlines exactly but you get the idea. The abbreviations don’t really give much information, either. Convert TCWW to factor and provide better labels for your legend.
ww_wlin <- shp_to_df(gis$al092017_019_ww_wwlin)
ww_wlin$TCWW <- factor(ww_wlin$TCWW,
                              levels = c("TWA", "TWR", "HWA", "HWR"),
                              labels = c("Tropical Storm Watch","Tropical Storm Warning","Hurricane Watch","Hurricane Warning"))

bp +
  geom_path(data = ww_wlin,
            aes(x = long, y = lat, group = group, color = TCWW), size = 1)
![]()
See Forecast/Adivsory GIS on the rrricanes website for an example of putting all of this data together in one map.
gis_prob_storm_surge
We can also plot the probablistic storm surge for given locations. Again, you will need the storm Key for this function. There are two additional parameters:
products can be one or both of “esurge” and “psurge”. esurge shows the probability of the cyclone exceeding the given storm surge plus tide within a given forecast period. psurge shows the probability of a given storm surge within a specified forecast period.
One or more products may not exist depending on the cyclone and advisory.
The products parameter expects a list of values for each product. For esurge products, valid values are 10, 20, 30, 40 or 50. For psurge products, valid values are 0, 1, 2, …, 20.
Let’s see if any esurge products exist for Harvey.
length(gis_prob_storm_surge(key = key,
                            products = list("esurge" = seq(10, 50, by = 10))))
## [1] 150
And psurge:
length(gis_prob_storm_surge(key = key, products = list("psurge" = 0:20)))
## [1] 630
So, we have access to a ton of data here. When discussing gis_advisory, we were able to filter by advisory number. With gis_prob_storm_surge, this is not an option; we have to use the datetime parameter to filter. Let’s find the Date for advisory 19.
(d <- ds$fstadv %>% filter(Adv == 19) %>% pull(Date))
## [1] "2017-08-25 03:00:00 UTC"
esurge
Now, let’s view all esurge products for date only (exlude time).
gis_prob_storm_surge(key = key,
                     products = list("esurge" = seq(10, 50, by = 10)),
                     datetime = strftime(d, "%Y%m%d", tz = "UTC"))
##  [1] "http://www.nhc.noaa.gov/gis/storm_surge/al092017_esurge10_2017082500.zip"
##  [2] "http://www.nhc.noaa.gov/gis/storm_surge/al092017_esurge10_2017082506.zip"
##  [3] "http://www.nhc.noaa.gov/gis/storm_surge/al092017_esurge10_2017082512.zip"
##  [4] "http://www.nhc.noaa.gov/gis/storm_surge/al092017_esurge10_2017082518.zip"
##  [5] "http://www.nhc.noaa.gov/gis/storm_surge/al092017_esurge20_2017082500.zip"
##  [6] "http://www.nhc.noaa.gov/gis/storm_surge/al092017_esurge20_2017082506.zip"
##  [7] "http://www.nhc.noaa.gov/gis/storm_surge/al092017_esurge20_2017082512.zip"
##  [8] "http://www.nhc.noaa.gov/gis/storm_surge/al092017_esurge20_2017082518.zip"
##  [9] "http://www.nhc.noaa.gov/gis/storm_surge/al092017_esurge30_2017082500.zip"
## [10] "http://www.nhc.noaa.gov/gis/storm_surge/al092017_esurge30_2017082506.zip"
## [11] "http://www.nhc.noaa.gov/gis/storm_surge/al092017_esurge30_2017082512.zip"
## [12] "http://www.nhc.noaa.gov/gis/storm_surge/al092017_esurge30_2017082518.zip"
## [13] "http://www.nhc.noaa.gov/gis/storm_surge/al092017_esurge40_2017082500.zip"
## [14] "http://www.nhc.noaa.gov/gis/storm_surge/al092017_esurge40_2017082506.zip"
## [15] "http://www.nhc.noaa.gov/gis/storm_surge/al092017_esurge40_2017082512.zip"
## [16] "http://www.nhc.noaa.gov/gis/storm_surge/al092017_esurge40_2017082518.zip"
## [17] "http://www.nhc.noaa.gov/gis/storm_surge/al092017_esurge50_2017082500.zip"
## [18] "http://www.nhc.noaa.gov/gis/storm_surge/al092017_esurge50_2017082506.zip"
## [19] "http://www.nhc.noaa.gov/gis/storm_surge/al092017_esurge50_2017082512.zip"
## [20] "http://www.nhc.noaa.gov/gis/storm_surge/al092017_esurge50_2017082518.zip"
That’s still quite a bit. We can filter it to more by adding hour to the datetime parameter.
gis_prob_storm_surge(key = key,
                     products = list("esurge" = seq(10, 50, by = 10)),
                     datetime = strftime(d, "%Y%m%d%H", tz = "UTC"))
This call will give you an error:
Error: No data available for requested storm/advisory
But, this isn’t entirely correct. When an advisory package is issued it contains information for the release time. Some of the GIS datasets are based on the release time -3 hours. So, we need to subtract 3 hours from d.
Note: There is an additional value that, as of the latest release is not extracted, records the position of the cyclone three hours prior. (As I understand it from the NHC, this is due to the time it takes to collect and prepare the data.) Per Issue #102, these values will be added for release 0.2.1. Therefore, instead of subtracting three hours from the Date variable, you can simply use the PrevPosDate value for this function.
Let’s try it again with the math:
gis_prob_storm_surge(key = key,
                     products = list("esurge" = seq(10, 50, by = 10)),
                     datetime = strftime(d - 60 * 60 * 3, "%Y%m%d%H",
                                         tz = "UTC"))
## [1] "http://www.nhc.noaa.gov/gis/storm_surge/al092017_esurge10_2017082500.zip"
## [2] "http://www.nhc.noaa.gov/gis/storm_surge/al092017_esurge20_2017082500.zip"
## [3] "http://www.nhc.noaa.gov/gis/storm_surge/al092017_esurge30_2017082500.zip"
## [4] "http://www.nhc.noaa.gov/gis/storm_surge/al092017_esurge40_2017082500.zip"
## [5] "http://www.nhc.noaa.gov/gis/storm_surge/al092017_esurge50_2017082500.zip"
As I don’t want to get all of these datasets, I’ll limit my esurge to show surge values with at least a 50% chance of being exceeded:
gis <- gis_prob_storm_surge(key = key,
                            products = list("esurge" = 50),
                            datetime = strftime(d - 60 * 60 * 3, "%Y%m%d%H",
                                                tz = "UTC")) %>%
  gis_download()
## OGR data source with driver: ESRI Shapefile
## Source: "/var/folders/gs/4khph0xs0436gmd2gdnwsg080000gn/T//Rtmp1wYg2x", layer: "al092017_2017082500_e50"
## with 97 features
## It has 2 fields
This will bring us a spatial polygon dataframe.
df <- shp_to_df(gis$al092017_2017082500_e50)
bb <- sp::bbox(gis$al092017_2017082500_e50)
str(df)
## Classes 'tbl_df', 'tbl' and 'data.frame':	161313 obs. of  9 variables:
##  $ long   : num  -93.2 -93.2 -93.2 -93.2 -93.2 ...
##  $ lat    : num  29.9 29.9 29.9 29.9 29.9 ...
##  $ order  : int  1 2 3 4 5 6 7 8 9 10 ...
##  $ hole   : logi  FALSE FALSE FALSE FALSE FALSE FALSE ...
##  $ piece  : Factor w/ 349 levels "1","2","3","4",..: 1 1 1 1 1 1 1 1 1 1 ...
##  $ group  : Factor w/ 7909 levels "0.1","0.2","0.3",..: 1 1 1 1 1 1 1 1 1 1 ...
##  $ id     : chr  "0" "0" "0" "0" ...
##  $ POINTID: int  1 1 1 1 1 1 1 1 1 1 ...
##  $ TCSRG50: num  0 0 0 0 0 0 0 0 0 0 ...
al_tracking_chart(color = "black", size = 0.1, fill = "white") +
  geom_polygon(data = df,
            aes(x = long, y = lat, group = group, color = TCSRG50)) +
  coord_equal(xlim = c(bb[1,1], bb[1,2]),
              ylim = c(bb[2,1], bb[2,2]))

This plot tells us that, along the central Texas coast, the expected storm surge along with tides is greater than 7.5 feet and there is a 50% chance of this height being exceeded.
psurge
The psurge product gives us the probabilistic storm surge for a location within the given forecast period.
gis <- gis_prob_storm_surge(key = key,
                            products = list("psurge" = 20),
                            datetime = strftime(d - 60 * 60 * 3, "%Y%m%d%H",
                                                tz = "UTC")) %>%
  gis_download()
## OGR data source with driver: ESRI Shapefile
## Source: "/var/folders/gs/4khph0xs0436gmd2gdnwsg080000gn/T//Rtmp1wYg2x", layer: "al092017_2017082500_gt20"
## with 12 features
## It has 2 fields
This will bring us a spatial polygon dataframe.
df <- shp_to_df(gis$al092017_2017082500_gt20)
bb <- sp::bbox(gis$al092017_2017082500_gt20)
str(df)
## Classes 'tbl_df', 'tbl' and 'data.frame':	3293 obs. of  9 variables:
##  $ long     : num  -96.8 -96.8 -96.8 -96.8 -96.8 ...
##  $ lat      : num  28.5 28.5 28.4 28.4 28.4 ...
##  $ order    : int  1 2 3 4 5 6 7 8 9 10 ...
##  $ hole     : logi  FALSE FALSE FALSE FALSE FALSE FALSE ...
##  $ piece    : Factor w/ 54 levels "1","2","3","4",..: 1 1 1 1 1 1 1 1 1 1 ...
##  $ group    : Factor w/ 227 levels "0.1","0.2","0.3",..: 1 1 1 1 1 1 1 1 1 1 ...
##  $ id       : chr  "0" "0" "0" "0" ...
##  $ POINTID  : int  1 1 1 1 1 1 1 1 1 1 ...
##  $ PSurge20c: num  1 1 1 1 1 1 1 1 1 1 ...
al_tracking_chart(color = "black", size = 0.1, fill = "white") +
  geom_polygon(data = df,
            aes(x = long, y = lat, group = group, color = PSurge20c)) +
  coord_equal(xlim = c(bb[1,1], bb[1,2]),
              ylim = c(bb[2,1], bb[2,2]))

This map shows the cumulative probability that a storm surge of greater than 20 feet will be seen within the highlighted regions.
This particular map doesn’t help much as we’ve zoomed in too far. What may provide use is a list of probability stations as obtained from the NHC. For this, you can use al_prblty_stations (ep_prblty_stations returns FALSE since, as of this writing, the format is invalid).
stations <- al_prblty_stations()

al_tracking_chart(color = "black", size = 0.1, fill = "white") +
  geom_polygon(data = df,
            aes(x = long, y = lat, group = group, color = PSurge20c)) +
  geom_label(data = stations, aes(x = Lon, y = Lat, label = Location)) +
  coord_equal(xlim = c(bb[1,1], bb[1,2]),
              ylim = c(bb[2,1], bb[2,2]))

gis_windfield
When possible, there may also be a cyclone wind radius dataset for the current and forecast positions. With this function we can resort back to Key and an advisory number.
gis <- gis_windfield(key = key, advisory = 19) %>%
  gis_download()
## OGR data source with driver: ESRI Shapefile
## Source: "/var/folders/gs/4khph0xs0436gmd2gdnwsg080000gn/T//Rtmp1wYg2x", layer: "al092017_2017082503_forecastradii"
## with 15 features
## It has 13 fields
## OGR data source with driver: ESRI Shapefile
## Source: "/var/folders/gs/4khph0xs0436gmd2gdnwsg080000gn/T//Rtmp1wYg2x", layer: "al092017_2017082503_initialradii"
## with 3 features
## It has 13 fields
names(gis)
## [1] "al092017_2017082503_forecastradii" "al092017_2017082503_initialradii"
Let’s get the bounding box and plot our initialradii dataset.
bb <- sp::bbox(gis$al092017_2017082503_initialradii)

al_tracking_chart(color = "black", size = 0.1, fill = "white") +
  geom_polygon(data = shp_to_df(gis$al092017_2017082503_initialradii),
            aes(x = long, y = lat, group = group, fill = factor(RADII)),
            alpha = 0.5) +
  coord_equal(xlim = c(bb[1,1], bb[1,2]),
              ylim = c(bb[2,1], bb[2,2]))

And add the forecast wind radii data onto the chart (modifying bb):
bb <- sp::bbox(gis$al092017_2017082503_forecastradii)

al_tracking_chart(color = "black", size = 0.1, fill = "white") +
  geom_polygon(data = shp_to_df(gis$al092017_2017082503_initialradii),
            aes(x = long, y = lat, group = group, fill = factor(RADII)),
            alpha = 0.5) +
  geom_polygon(data = shp_to_df(gis$al092017_2017082503_forecastradii),
               aes(x = long, y = lat, group = group, fill = factor(RADII)),
               alpha = 0.5) +
  geom_label(data = stations, aes(x = Lon, y = Lat, label = Location)) +
  coord_equal(xlim = c(bb[1,1], bb[1,2]),
              ylim = c(bb[2,1], bb[2,2]))

gis_wsp
Our last GIS dataset is wind speed probabilities. This dataset is not storm specific nor even basin-specific; you may get results for cyclones halfway across the world.
The two parameters needed are:
datetime - again, using the %Y%m%d%H format (not all values are required)
res - Resolution of the probabilities; 5 degrees, 0.5 degrees and 0.1 degrees.
Wind fields are for 34, 50 and 64 knots. Not all resolutions or windfields will be available at a given time.
Sticking with our variable d, let’s first make sure there is a dataset that exists for that time.
gis_wsp(datetime = strftime(d - 60 * 60 * 3, format = "%Y%m%d%H", tz = "UTC"))
## [1] "http://www.nhc.noaa.gov/gis/"
For this article, we’ll stick to the higher resolution plot.
we need a temporarily fixed function to replace gis_wsp(), which will be
fixed in package soon
gis_wsp_2 <- function(datetime, res = c(5, 0.5, 0.1)) {
  res <- as.character(res)
  res <- stringr::str_replace(res, "^5$", "5km")
  res <- stringr::str_replace(res, "^0.5$", "halfDeg")
  res <- stringr::str_replace(res, "^0.1$", "tenthDeg")
  year <- stringr::str_sub(datetime, 0L, 4L)
  request <- httr::GET("http://www.nhc.noaa.gov/gis/archive_wsp.php",
                       query = list(year = year))
  contents <- httr::content(request, as = "parsed", encoding = "UTF-8")
  ds <- rvest::html_nodes(contents, xpath = "//a") %>% rvest::html_attr("href") %>%
    stringr::str_extract(".+\\.zip$") %>% .[stats::complete.cases(.)]
  if (nchar(datetime) < 10) {
    ptn_datetime <- paste0(datetime, "[:digit:]+")
  } else {
    ptn_datetime <- datetime
  }
  ptn_res <- paste(res, collapse = "|")
  ptn <- sprintf("%s_wsp_[:digit:]{1,3}hr(%s)", ptn_datetime,
                 ptn_res)
  links <- ds[stringr::str_detect(ds, ptn)]
  links <- paste0("http://www.nhc.noaa.gov/gis/", links)
  return(links)
}
gis <- gis_wsp_2(
  datetime = strftime(d - 60 * 60 * 3, format = "%Y%m%d%H", tz = "UTC"),
  res = 5) %>%
  gis_download()
## OGR data source with driver: ESRI Shapefile
## Source: "/var/folders/gs/4khph0xs0436gmd2gdnwsg080000gn/T//Rtmp1wYg2x", layer: "2017082500_wsp34knt120hr_5km"
## with 11 features
## It has 1 fields
## OGR data source with driver: ESRI Shapefile
## Source: "/var/folders/gs/4khph0xs0436gmd2gdnwsg080000gn/T//Rtmp1wYg2x", layer: "2017082500_wsp50knt120hr_5km"
## with 11 features
## It has 1 fields
## OGR data source with driver: ESRI Shapefile
## Source: "/var/folders/gs/4khph0xs0436gmd2gdnwsg080000gn/T//Rtmp1wYg2x", layer: "2017082500_wsp64knt120hr_5km"
## with 11 features
## It has 1 fields
All of these datasets are spatial polygon dataframes. Again, we will need to convert to dataframe using shp_to_df.
bb <- sp::bbox(gis$`2017082500_wsp34knt120hr_5km`)
Examine the structure.
df <- shp_to_df(gis$`2017082500_wsp34knt120hr_5km`)
str(df)
## Classes 'tbl_df', 'tbl' and 'data.frame':	24182 obs. of  8 variables:
##  $ long      : num  -97.2 -97.2 -97.2 -97.3 -97.3 ...
##  $ lat       : num  20.3 20.3 20.3 20.3 20.4 ...
##  $ order     : int  1 2 3 4 5 6 7 8 9 10 ...
##  $ hole      : logi  FALSE FALSE FALSE FALSE FALSE FALSE ...
##  $ piece     : Factor w/ 8 levels "1","2","3","4",..: 1 1 1 1 1 1 1 1 1 1 ...
##  $ group     : Factor w/ 52 levels "0.1","0.2","0.3",..: 1 1 1 1 1 1 1 1 1 1 ...
##  $ id        : chr  "0" "0" "0" "0" ...
##  $ PERCENTAGE: chr  "<5%" "<5%" "<5%" "<5%" ...
al_tracking_chart(color = "black", size = 0.1, fill = "white") +
  geom_polygon(data = df,
               aes(x = long, y = lat, group = group, fill = PERCENTAGE),
               alpha = 0.25) +
  coord_equal(xlim = c(bb[1,1], bb[1,2]),
              ylim = c(bb[2,1], bb[2,2]))

There aren’t many ways we can narrow this down other than using arbitrary longitude values. The observations in the dataset do not have a variable identifying which storm each set of values belongs to. So, I’ll remove the coord_equal call so we’re only focused on the Atlantic basin.
al_tracking_chart(color = "black", size = 0.1, fill = "white") +
  geom_polygon(data = df,
               aes(x = long, y = lat, group = group, fill = PERCENTAGE),
               alpha = 0.25)

Of course, you can narrow it down further as you see fit.
Do not confuse this GIS dataset with the wndprb product or similar prblty products; both of which only identify probabilities for given locations.
gis_latest
For active cyclones, you can retrieve all available GIS datasets using gis_latest. Note that, unlike the previous GIS functions, this function will return a list of all GIS dataframes available.
gis <- gis_latest()
Now we have a large list of GIS spatial dataframes. Two things to point out here; first, we now have a “windswath” GIS dataset. This dataset, to the best of my knowledge, does not exist on it’s own. Therefore, no archived “windswath” datasets are available.
Second, I have found this data fluctuates even from minute to minute. Earlier this year when attempting to develop automated reporting, I found the return value of the call would vary almost with every call.
Of course, that doesn’t mean it is not valuable, and why it has been included. You can easily perform checks for specific data you are looking for. If it doesn’t exist, bail and try again in a few minutes.
Potential Issues Using rrricanes
I cannot stress enough that rrricanesis not intended for use during emergency situations, as I myself learned during Hurricane Harvey. The package currently relies on the NHC website which, I truly believe, is curated by hand.
The most common problems I’ve noticed are:
The NHC website unable to load or slow to respond. This was a hassle in previous releases but seems to be ironed out as of release 0.2.0.6. Nonetheless, there may be instances where response time is slow.
Incorrect storm archive links. Another example would be during Harvey when the link to Harvey’s archive page was listed incorrectly. If I manually typed the link as it should be, the storm’s correct archive page would load. However, the NHC website listed it incorrectly on the annual archives page.
As I become more aware of potential problems, I will look for workarounds. I would be greatly appreciative of any problems being posted to the rrricanes repository.
I will also post known issues beyond my control (such as NHC website issues) to Twitter using the #rrricanes hashtag.
Future Plans
The following data will be added to rrricanes as time allows:
Reconnaissance data (release 0.2.2)
Computer forecast model data (release 0.2.3)
Archived satellite images (tentative)
Ship and buoy data (tentative)
Reconnaissance data itself will be a massive project. There are numerous types of products. And, as advisory product formats have changed over the years, so have these. Any help in this task would be tremendously appreciated!
Some computer forecast models are in the public domain and can certainly be of tremendous use. Some are difficult to find (especially archived). The caution in this area is that many websites post this data but may have limitations on how it can be accessed.
Additionally, data may be added as deemed fitting.
Contribute
Anyone is more than welcome to contribute to the package. I would definitely appreciate any help. See Contributions for more information.
I would ask that you follow the Tidyverse style guide. Release 0.2.1 will fully incorporate these rules.
You do not need to submit code in order to be listed as a contributor. If there is a data source (that can legally be scraped) that you feel should be added, please feel free to submit a request. Submitting bug reports and feature requests are all extremely valuable to the success of rrricanes.
Acknowledgments
I want to thank the rOpenSci community for embracing rrricanes and accepting the package into their vast portfolio. This is my first attempt and putting a project into part of a larger community and the lessons learned have been outstanding.
I want to thank Maelle Salmon who, in a sense, has been like a guiding angel from start to finish during the entire onboarding and review process.
I want to give a very special thanks to Emily Robinson and Joseph Stachelek for taking the time to put rrricanes to the test, giving valuable insight and recommendations on improving it.
And a thank-you also to James Molyneux, Mark Padgham, and Bob Rudis, all of whom have offered guidance or input that has helped make rrricanes far better than it would have been on my own.


 David Smith is a Blogger and Community Lead at Microsoft. I had the chance to interview David last May at rOpenSci unconf17. We spoke about his career, the process of working remote within a team, community development/outreach and his personal methods for discovering great content to share and write about.


 Mara Averick is a non-profit data nerd, NBA stats junkie, and most recently, tidyverse developer advocate at RStudio. She is the voice behind two very popular Twitter accounts, @dataandme and @batpigandme. Mara and I discussed sports analytics, how attending a cool conference can change the approach to your career, and how she uses Twitter as a mechanism for self-imposed forced learning.


 Attendees at the May 2017 rOpenSci unconference. Photo credit: Nistara Randhawa